Homeowners insurance
Average Cost of Homeowners Insurance (2026 Guide) | YourHomeCosts
By the YourHomeCosts editorial team. Last updated . General information, not insurance, financial, or legal advice.
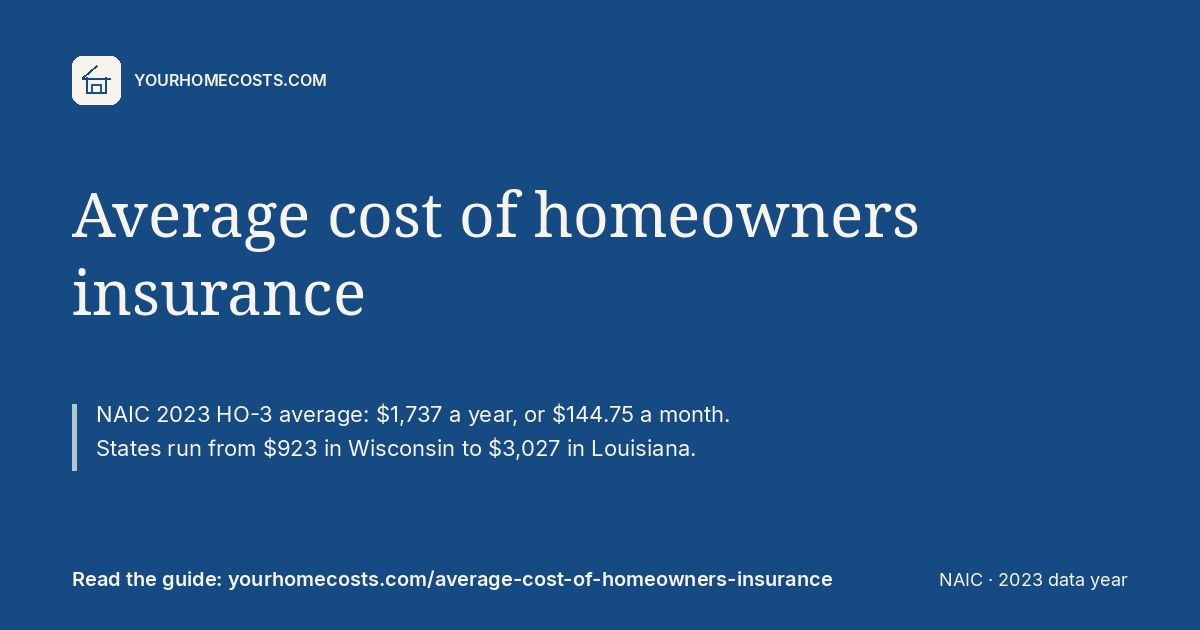
The average cost of homeowners insurance on the most common owner-occupied policy (HO-3) was $1,737 a year, or $144.75 a month, in the NAIC's latest report (2023 data year). State averages run from $923 in Wisconsin to $3,027 in Louisiana. It is not a quote for any house.
A separate NAIC research report dated July 31, 2026, using 2024 market-conduct data, puts a broader average at $1,600 per policy. That second figure mixes renters, condo, dwelling, and homeowners forms, and it leaves New York out. The two numbers answer different questions. Neither one is a 2026 renewal for a specific address.
How we checked this: the NAIC reports, the CFPB pages, state insurance regulators, and the October 20, 2026 Los Angeles Times and Insurance Journal articles were read on October 21, 2026.
Educational information only. This is not financial, tax, legal, lending, insurance, or appraisal advice. Loan documents, state law, and your servicer or assessor control. Confirm every figure before you act.
Estimates only; your lender's numbers win.
What is the average cost of homeowners insurance?
For an owner-occupied house, use the HO-3 average in the NAIC report Dwelling Fire, Homeowners Owner-Occupied, and Homeowners Tenant and Condominium/Cooperative Unit Owner’s Insurance Report: Data for 2023. Table 4’s countrywide HO-3 total is $1,737. A house-year is 12 months of coverage on a dwelling, one full policy or several shorter ones that add up to a year. The report calls HO-3 the most common package: “all-risks” coverage on the building, with the policy’s named exclusions, and broad named-peril coverage on personal property. In 2023 it was 79.5 percent of owner-occupied homeowners exposures.
Other forms in the same report show why one national average misleads. Countrywide, HO-5 averaged $1,891 and the blend of dwelling fire plus every owner-occupied form averaged $1,731. Tenant HO-4 policies averaged $173, and condo and co-op HO-6 policies averaged $658. The NAIC says an average is an imperfect price. The same form and the same amount of insurance can still differ sharply, because the premium follows the amount of insurance (generally the value of the insured property), the property and perils covered, and the limits and deductibles chosen. Earthquake premium is excluded even when an endorsement adds it. The NAIC consumer guide says a homeowners policy does not cover flood, and that a lender usually requires a separate flood policy in a flood plain.
Texas and California data come from their state insurance departments, so their forms differ slightly.
The newer NAIC study, dated July 31, 2026, is a different average. In 2024, 715 companies with at least $50,000 of premium had 103,289,334 policies and $165.2 billion of direct premium, or $1,600 a policy. That mix includes dwelling forms and HO-1 through HO-8, so renters and condos pull it down. New York is outside the 2018–2024 set, and excess-and-surplus carriers are outside the data. Zone averages are $1,818 in the Southeast, $1,600 in the West, $1,476 in the Midwest, and $1,396 in the Northeast. Nominal premium per policy rose 44 percent to 74 percent by zone since 2018. In 2025 dollars, using the Personal Consumption Expenditures index, the report’s range is 18.3 percent to 43.3 percent. It cites 21.5 percent cumulative PCE inflation from 2018 to 2024.
How much is homeowners insurance by state?
The state table uses the HO-3 total row in NAIC Table 4 for the 2023 data year. Each annual number is the state’s written HO-3 premium divided by HO-3 house-years, the same method as the countrywide $1,737. The monthly column is this page’s calculation: the annual average divided by 12, rounded to the cent. The NAIC report prints the annual average. It does not print a monthly premium.
Wisconsin is the low end at $923 a year ($76.92 a month). Louisiana is the high end at $3,027 ($252.25). Texas is $2,864 ($238.67) and Florida is $2,779 ($231.58). Those ranks describe the 2023 HO-3 book of business. A state with more high-limit policies, or with wind premium and no matching exposure, prints a higher average even when two identical houses would be priced alike. California is $1,655 and the District of Columbia is $1,545, with the Texas and California form note above. A row is not a quote and not a 2026 renewal.
| State | Annual average | Monthly average |
|---|---|---|
| Countrywide | $1,737 | $144.75 |
| Alabama | $1,906 | $158.83 |
| Alaska | $1,216 | $101.33 |
| Arizona | $1,194 | $99.50 |
| Arkansas | $1,870 | $155.83 |
| California | $1,655 | $137.92 |
| Colorado | $2,492 | $207.67 |
| Connecticut | $2,036 | $169.67 |
| Delaware | $1,196 | $99.67 |
| District of Columbia | $1,545 | $128.75 |
| Florida | $2,779 | $231.58 |
| Georgia | $1,828 | $152.33 |
| Hawaii | $1,549 | $129.08 |
| Idaho | $1,135 | $94.58 |
| Illinois | $1,480 | $123.33 |
| Indiana | $1,259 | $104.92 |
| Iowa | $1,342 | $111.83 |
| Kansas | $1,733 | $144.42 |
| Kentucky | $1,525 | $127.08 |
| Louisiana | $3,027 | $252.25 |
| Maine | $1,150 | $95.83 |
| Maryland | $1,578 | $131.50 |
| Massachusetts | $2,134 | $177.83 |
| Michigan | $1,110 | $92.50 |
| Minnesota | $1,988 | $165.67 |
| Mississippi | $2,029 | $169.08 |
| Missouri | $1,589 | $132.42 |
| Montana | $1,768 | $147.33 |
| Nebraska | $2,142 | $178.50 |
| Nevada | $1,013 | $84.42 |
| New Hampshire | $1,300 | $108.33 |
| New Jersey | $1,551 | $129.25 |
| New Mexico | $1,490 | $124.17 |
| New York | $1,801 | $150.08 |
| North Carolina | $1,852 | $154.33 |
| North Dakota | $1,414 | $117.83 |
| Ohio | $1,116 | $93.00 |
| Oklahoma | $2,486 | $207.17 |
| Oregon | $1,003 | $83.58 |
| Pennsylvania | $1,217 | $101.42 |
| Rhode Island | $2,396 | $199.67 |
| South Carolina | $1,753 | $146.08 |
| South Dakota | $1,614 | $134.50 |
| Tennessee | $1,649 | $137.42 |
| Texas | $2,864 | $238.67 |
| Utah | $1,107 | $92.25 |
| Vermont | $1,215 | $101.25 |
| Virginia | $1,537 | $128.08 |
| Washington | $1,232 | $102.67 |
| West Virginia | $1,179 | $98.25 |
| Wisconsin | $923 | $76.92 |
| Wyoming | $1,853 | $154.42 |
How much should homeowners insurance cost on a $300,000 or $400,000 house?
No NAIC table states a price for a $300,000 or $400,000 sale price. The amount of insurance in Table 4 is the dwelling limit, the dollars of coverage. A sale price includes the land. The NAIC consumer guide says replacement cost and market value are not the same: market value includes the land and follows the real estate market, and the starting point for the limit is the cost to rebuild. An agent or a contractor may help estimate that cost. This page does not convert a sale price into a limit.
The 2023 countrywide HO-3 bands are averages for a limit, and the monthly figures are this page’s division by 12. A limit of $300,000 to $324,999 averaged $1,475 ($122.92 a month). The $325,000 to $349,999 band averaged $1,492. The $350,000 to $399,999 band averaged $1,598. The $400,000 to $449,999 band averaged $1,679 ($139.92 a month). Coverage of $149,999 and under averaged $954, and $1,000,000 and over averaged $4,314. The report says the average generally rises with the amount of coverage. A $300,000 or $400,000 purchase can land in any of those bands once the rebuild cost is estimated.
Compare quotes only after the limit and the deductible are chosen, and give each insurer the same location, size, year, and construction. The NAIC report says real estate values, construction costs, catastrophe exposure, fire protection, and state filing laws all show up in the price, locally as well as by state. The figure to hand a lender before a quote exists is the 2023 HO-3 band that matches the limit you intend to buy, labeled as that average. Matching a band to the sale price invents a limit the report did not use.
| Amount of insurance | Annual average | Monthly average |
|---|---|---|
| $149,999 and under | $954 | $79.50 |
| $300,000 to $324,999 | $1,475 | $122.92 |
| $325,000 to $349,999 | $1,492 | $124.33 |
| $350,000 to $399,999 | $1,598 | $133.17 |
| $400,000 to $449,999 | $1,679 | $139.92 |
| $1,000,000 and over | $4,314 | $359.50 |
Why does insurance now cost more than property taxes in most counties?
On October 20, 2026, the Los Angeles Times and Insurance Journal published the same Bloomberg account by Eric Roston. Both report that a Bloomberg Intelligence analysis found the average homeowners premium now exceeds the average property-tax bill in two-thirds of U.S. counties. They attribute the write-up to Andrew John Stevenson and say the analysis uses the U.S. Census, state insurance regulators, and federal weather and transportation agencies. This page read the articles. A separate Bloomberg Intelligence note was not available to recompute the counties. The figures in this section are what the articles report.
County-average homeowner policies rose an inflation-adjusted 45 percent in a decade, with Nebraska at 79 percent, the articles say. Stevenson writes that homeowners pay a county-level average of 14 percent more for insurance than for property tax. Hail and winter weather are described as lifting rates in the Midwest and Mountain West, led by Colorado, Utah, and Minnesota. In the Southeast, where the articles say property taxes are among the country’s lowest, premiums can run 2.5 to 4 times the tax levy. Higher taxes in the Northeast, the West, and large metros make insurance a smaller share of the tax bill. The articles also say extreme weather is part of the rate pressure and that deductibles have been rising.
That comparison is county average versus county average. It does not say every house pays more for insurance than for taxes, and it is not the 2023 NAIC HO-3 table. The years, the maps, and the meaning of “average” differ. Your tax disbursement and your insurance disbursement sit on the escrow statement. The escrow analysis page separates shortage, surplus, and the cushion. What PITI is names insurance as one of the four parts of principal, interest, taxes, and insurance.
What drives your premium?
The NAIC consumer guide starts with rebuild cost, which follows the structure and leaves land in the purchase price. Brick or masonry usually prices lower than wood frame. Fire-department distance, fire protection, age, and condition are on the list, along with claims on the house, nearby houses, and your own water, fire, theft, or liability claims. Most insurers report claims to databases such as CLUE. Limits, endorsements, the deductible, a companion auto policy, and tenure with the company also move the price. A higher deductible costs less, and some places write the catastrophe deductible as a percentage of the limit. The guide says that costs less only if you can pay it after a loss. Alarms, sprinklers, and deadbolts often earn a discount. A wood stove, a pool, some animals, and a home business can move the price up.
Credit-based insurance scores apply only where state law allows them. The NAIC page, last updated March 19, 2026, says insurers often use credit information for auto and homeowners eligibility and price. The score estimates the chance of a claim. It is a different tool from a score of whether a loan will be repaid. The NAIC page cites a FICO estimate that about 85 percent of homeowners insurers use the scores where they are allowed. In most states the score cannot be the sole reason to raise the rate or to deny, cancel, or refuse renewal, and many states require notice of an adverse decision. Some states, such as Maryland, bar credit history for homeowners pricing. Other states differ. The NAIC chart is the index. This page does not restate every statute.
Region sits under those household factors. The NAIC report says construction costs follow materials, climate, and codes; brush and forest fires are more common in the West; hurricane exposure is greater on the southeastern coast; and tornado exposure is greatest in the central and southeastern states. Earthquake premium stays out of the averages.
Why is homeowners insurance so expensive, and why did my premium go up?
The national expense is a higher rebuild cost, larger limits in the book of business, and catastrophe losses the NAIC describes as more frequent and more severe since the late 1980s. The inflation-adjusted zone increases of 18.3 percent to 43.3 percent since 2018, and the articles’ inflation-adjusted 45 percent rise in county-average premiums over a decade, describe groups of policies. They do not assign a cause to one renewal. The declarations page does. Why homeowners insurance went up is the walk-through: compare last year’s dwelling limit, deductible, and premium with this year’s. A higher limit can raise the premium at the same address. A claim can change the price and the offer to renew. A lost discount, or wind and hail moved onto a separate policy, changes the bill you are comparing. Reinsurance, coverage the insurer buys for a stack of claims, can raise the insurer’s cost without a line of its own on your page.
Wisconsin’s $923 average and Louisiana’s $3,027 average are the wrong benchmark for a house whose limit and roof look nothing like that state’s mix. Ask what changed, and ask for the same limit at the next deductible only if you could pay it. The NAIC guide’s shopping rule is to hold coverages and limits constant so a lower price is a price for the same contract.
How does a premium increase raise your mortgage payment through escrow?
When the servicer pays the homeowners bill, the premium is an escrow disbursement. The CFPB’s escrow page says taxes and insurance can change from year to year and the escrow part of the mortgage payment changes with them. What an escrow account is is the short version. The deposit for the bills is up to one-twelfth of the disbursements the servicer expects to pay, so a higher premium raises that twelfth. The CFPB’s PITI page says principal and interest generally stay the same if you pay on time, and it gives a balloon loan as a loan that works differently. A higher insurance bill does not, by itself, rewrite a fixed principal-and-interest schedule.
A shortage is separate. If last year was collected at the old premium and the servicer paid the new bill, the account can finish short. Under 12 CFR 1024.17, a shortage smaller than one month of escrow payments may be left alone, collected within 30 days, or spread over at least 12 months. A shortage at least that large, if collected, is spread in equal payments over at least 12 months. The escrow analysis page runs those tests. The payment explainer can take an old premium, a new premium, and a shortage already printed on your statement.
The table is an illustration with round inputs, not the NAIC average and not your analysis. The premium goes from $1,800 to $2,400. One-twelfth moves from $150 to $200, a $50 increase. The example assumes a $600 shortage collected over 12 months, another $50. For that year the insurance lines add $100 a month. Afterward the example’s deposit is $200 if nothing else changes. Taxes, the cushion, flood or wind, and mortgage insurance are left out. Regulation X lets a servicer also hold a cushion of up to one-sixth of the year's expected escrow disbursements (12 CFR 1024.17(c)). A real shortage has to be compared with the full monthly escrow payment, including taxes, before the 12-month rule is settled.
| Item | Amount |
|---|---|
| Previous annual premium | $1,800 |
| Renewal annual premium | $2,400 |
| Annual increase | $600 |
| Monthly deposit before | $150 |
| Monthly deposit after | $200 |
| Monthly change from the premium | $50 |
| Illustrative shortage | $600 |
| Shortage spread over 12 months | $50 |
| Extra monthly escrow during those 12 months | $100 |
How can you lower homeowners insurance?
The NAIC consumer guide treats shopping as a matched comparison. Set the dwelling limit from the rebuild cost and pick a deductible you can pay. Then ask each insurer for those same limits and that same deductible, with the same description of the house. A lower price at a lower limit is a different policy. Ask how the premium moves at the next deductible. Ask which discounts that company files. The guide names smoke detectors, burglar alarms, sprinklers, deadbolts, storm shutters, a new roof, updated wiring or plumbing, and an auto policy in the same company. A discount applies only when that insurer offers it and you qualify.
Confirm the license with the state insurance department. The guide says a business card is not proof, and many departments post a complaint index beside independent financial-strength ratings. This page does not rank insurers. The guide also says claim frequency and type often affect the renewal, and that a repair close to the deductible is sometimes paid without a claim. If you file, protect the house from further damage. The department is the complaint path if the claim stalls.
Letting the policy lapse can raise the cost. The NAIC guide says lenders generally require insurance for the life of the mortgage, and that a lapse often leads the lender to insure the structure at a premium that might be much higher, with coverage limited to the building. The CFPB says force-placed insurance is typically more expensive than a policy you buy. A replacement policy changes the mortgage payment after the servicer gets the declarations page and runs a new analysis. Until then, the payment can still reflect the old premium. This page does not predict a saving.
FAQ
What is the standard rate for homeowners insurance?
The NAIC does not publish one rate. Its 2023 countrywide averages differ by form: HO-3 is $1,737, HO-5 is $1,891, tenant HO-4 is $173, and condo HO-6 is $658. The premium still depends on the amount of insurance, the perils, the limits, and the deductible. A state department’s comparison guide is not a rate an insurer must charge.
What is a good monthly price for homeowners insurance?
Neither the NAIC nor the CFPB defines a good monthly price. The 2023 HO-3 countrywide average is $144.75 a month on a simple division by 12, and the state totals run from $76.92 in Wisconsin to $252.25 in Louisiana. Compare prices at the same dwelling limit and a deductible you can pay. The quote is the price for the house.
What is the 80% rule in home insurance?
The NAIC consumer guide says the dwelling limit should equal full replacement cost, which is not market value, and that if the limit drops below 80 percent of full replacement cost the insurer may reduce the claim payment. The New York Department of Financial Services illustrates one coinsurance version. Two houses each have a $100,000 replacement cost and a $5,000 roof loss. The owner at $80,000, which is 80 percent, is reimbursed aside from any deductible. The owner at $50,000 is paid the greater of actual cash value and a proportion: $50,000 divided by $80,000, times $5,000, which is $3,125. New York also says 80 percent can still leave a total loss short of a full rebuild. Your policy’s loss-settlement clause controls.
What is a house premium?
A house premium is the price of the homeowners policy for the policy term, usually a year, for the limits and deductible on the declarations page. In the NAIC report, the average premium is aggregate written premium divided by house-years, and it represents the cost of a year of coverage. The 2023 HO-3 countrywide average of $1,737 is that kind of average. It is not a product called a standard house premium, and it is not the monthly escrow deposit. The monthly deposit, when a servicer pays the bill, is about one-twelfth of the annual premium, before shortage or cushion.
Sources
- NAIC, Dwelling Fire, Homeowners Owner-Occupied, and Homeowners Tenant and Condominium/Cooperative Unit Owner’s Insurance Report: Data for 2023 (© 2026)
- NAIC, Examining Homeowner Property Insurance Market Dynamics, countrywide and state-level data from 2018 to 2024 (July 31, 2026)
- NAIC, A Consumer’s Guide to Home Insurance
- NAIC, Credit-Based Insurance Scores, last updated March 19, 2026
- Maryland COMAR 31.15.11.04, Homeowner’s insurance, prohibition on use of credit history
- New York Department of Financial Services, How much insurance do you need?
- CFPB, What is an escrow or impound account?, last reviewed September 11, 2024
- CFPB, What is PITI?, last reviewed September 11, 2024
- 12 CFR 1024.17, Escrow accounts, Consumer Financial Protection Bureau
- Los Angeles Times, Eric Roston, October 20, 2026, Home insurance now costs more than property taxes in most U.S. counties
- Insurance Journal, Eric Roston, October 20, 2026, Home Insurance Tops Property Taxes in Squeeze for US Households
A short note when the guides change
Signups open soon. Check back here.